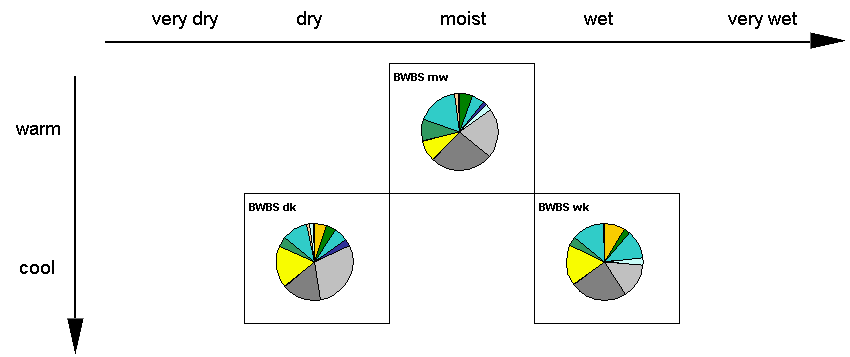
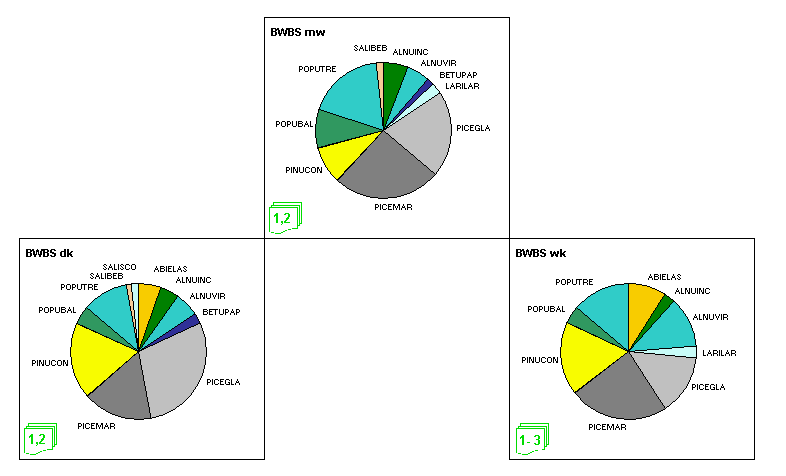
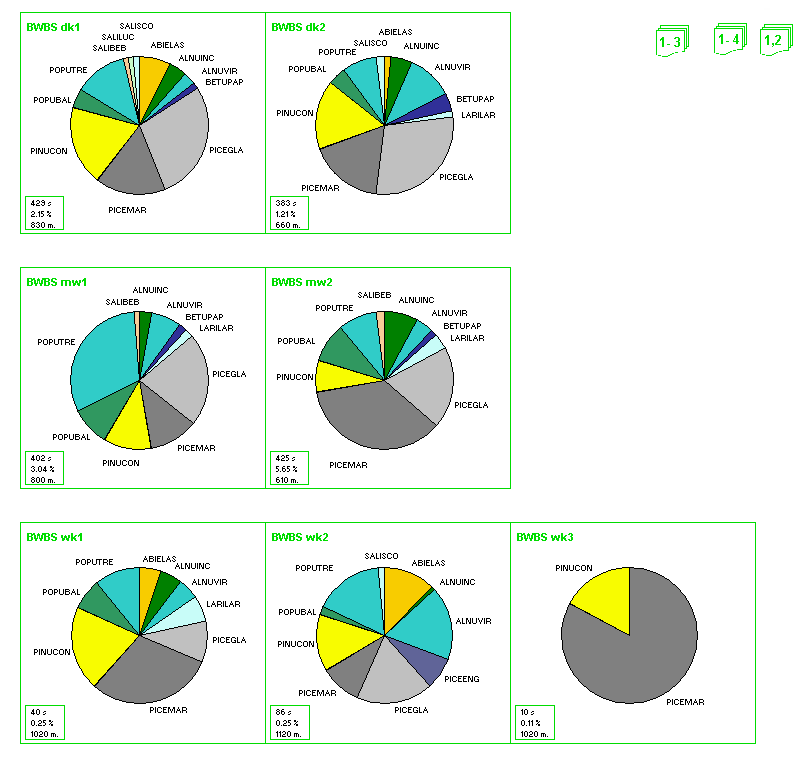
BWBS species composition
The species composition pie charts indicate the relative abundance of the different tree species present in the subzone or variant. Minor species with values less than 1% are not shown. The relative abundance values were generated from tree species cover values obtained from the provincial ecology program’s detailed vegetation inventory plots. The analysis was done at the variant level or, if variants are not recognized, at the subzone level. The number of plots used in the analysis is indicated in the “stats.” inset.
Statistics inset for subzone and variant pie charts
| s – sample size (number of 0.4 ha inventory plots used in the analysis); % – percentage of BC land base covered by the subzone or variant; m – average elevation (m) of the subzone or variant. Note – Species which have with less 1% of their provincial cumulative cover located in the zone are not included |
Species codes
The BC MOF assigns all BC plant species a 7 or 8 character code which is used in database applications. The code is usually generated from the first three letters of the genus name plus the first four letters of the species name. We use the species codes in these pie charts instead of the longer common or latin names. The species code legend is located at the bottom of this page or opened on a separate page.
Overview

Subzones

Variants

